With the world’s energy production gradually moving from fossil fuels towards sustainable energy sources like wind and sun, the people designing the energy systems of the future are facing new challenges: They need to know as precisely as possible how much sun or wind to expect at any given time, in order to satisfy the energy demands of a region or a country.
Fastest growing energy source
Researchers from the University of Aarhus, Denmark, have now given energy planners across the world an important new tool for integrating solar power into the decentralized energy infrastructure of the future.
On a global scale, solar power is the fastest growing sustainable energy source. From 2010 to 2017 the yearly growth rate of solar cells has amounted to an astonishing 24 per cent, and over the last three years more solar power plants have been installed than any other energy source. Moreover, the price of solar panels has gone down significantly.
This means that soon solar energy will play an equally important part in sustainable energy systems than wind energy. But to harness the full potential of solar energy you need precise models of how much energy solar panels are producing.
Solar energy model
This is what Marta Victoria and Gorm B. Andresen from the university’s Department of Engineering have done. They have designed a uniquely detailed and precise model of solar energy potential on a global scale, and they are offering their data free of charge for everybody to use.
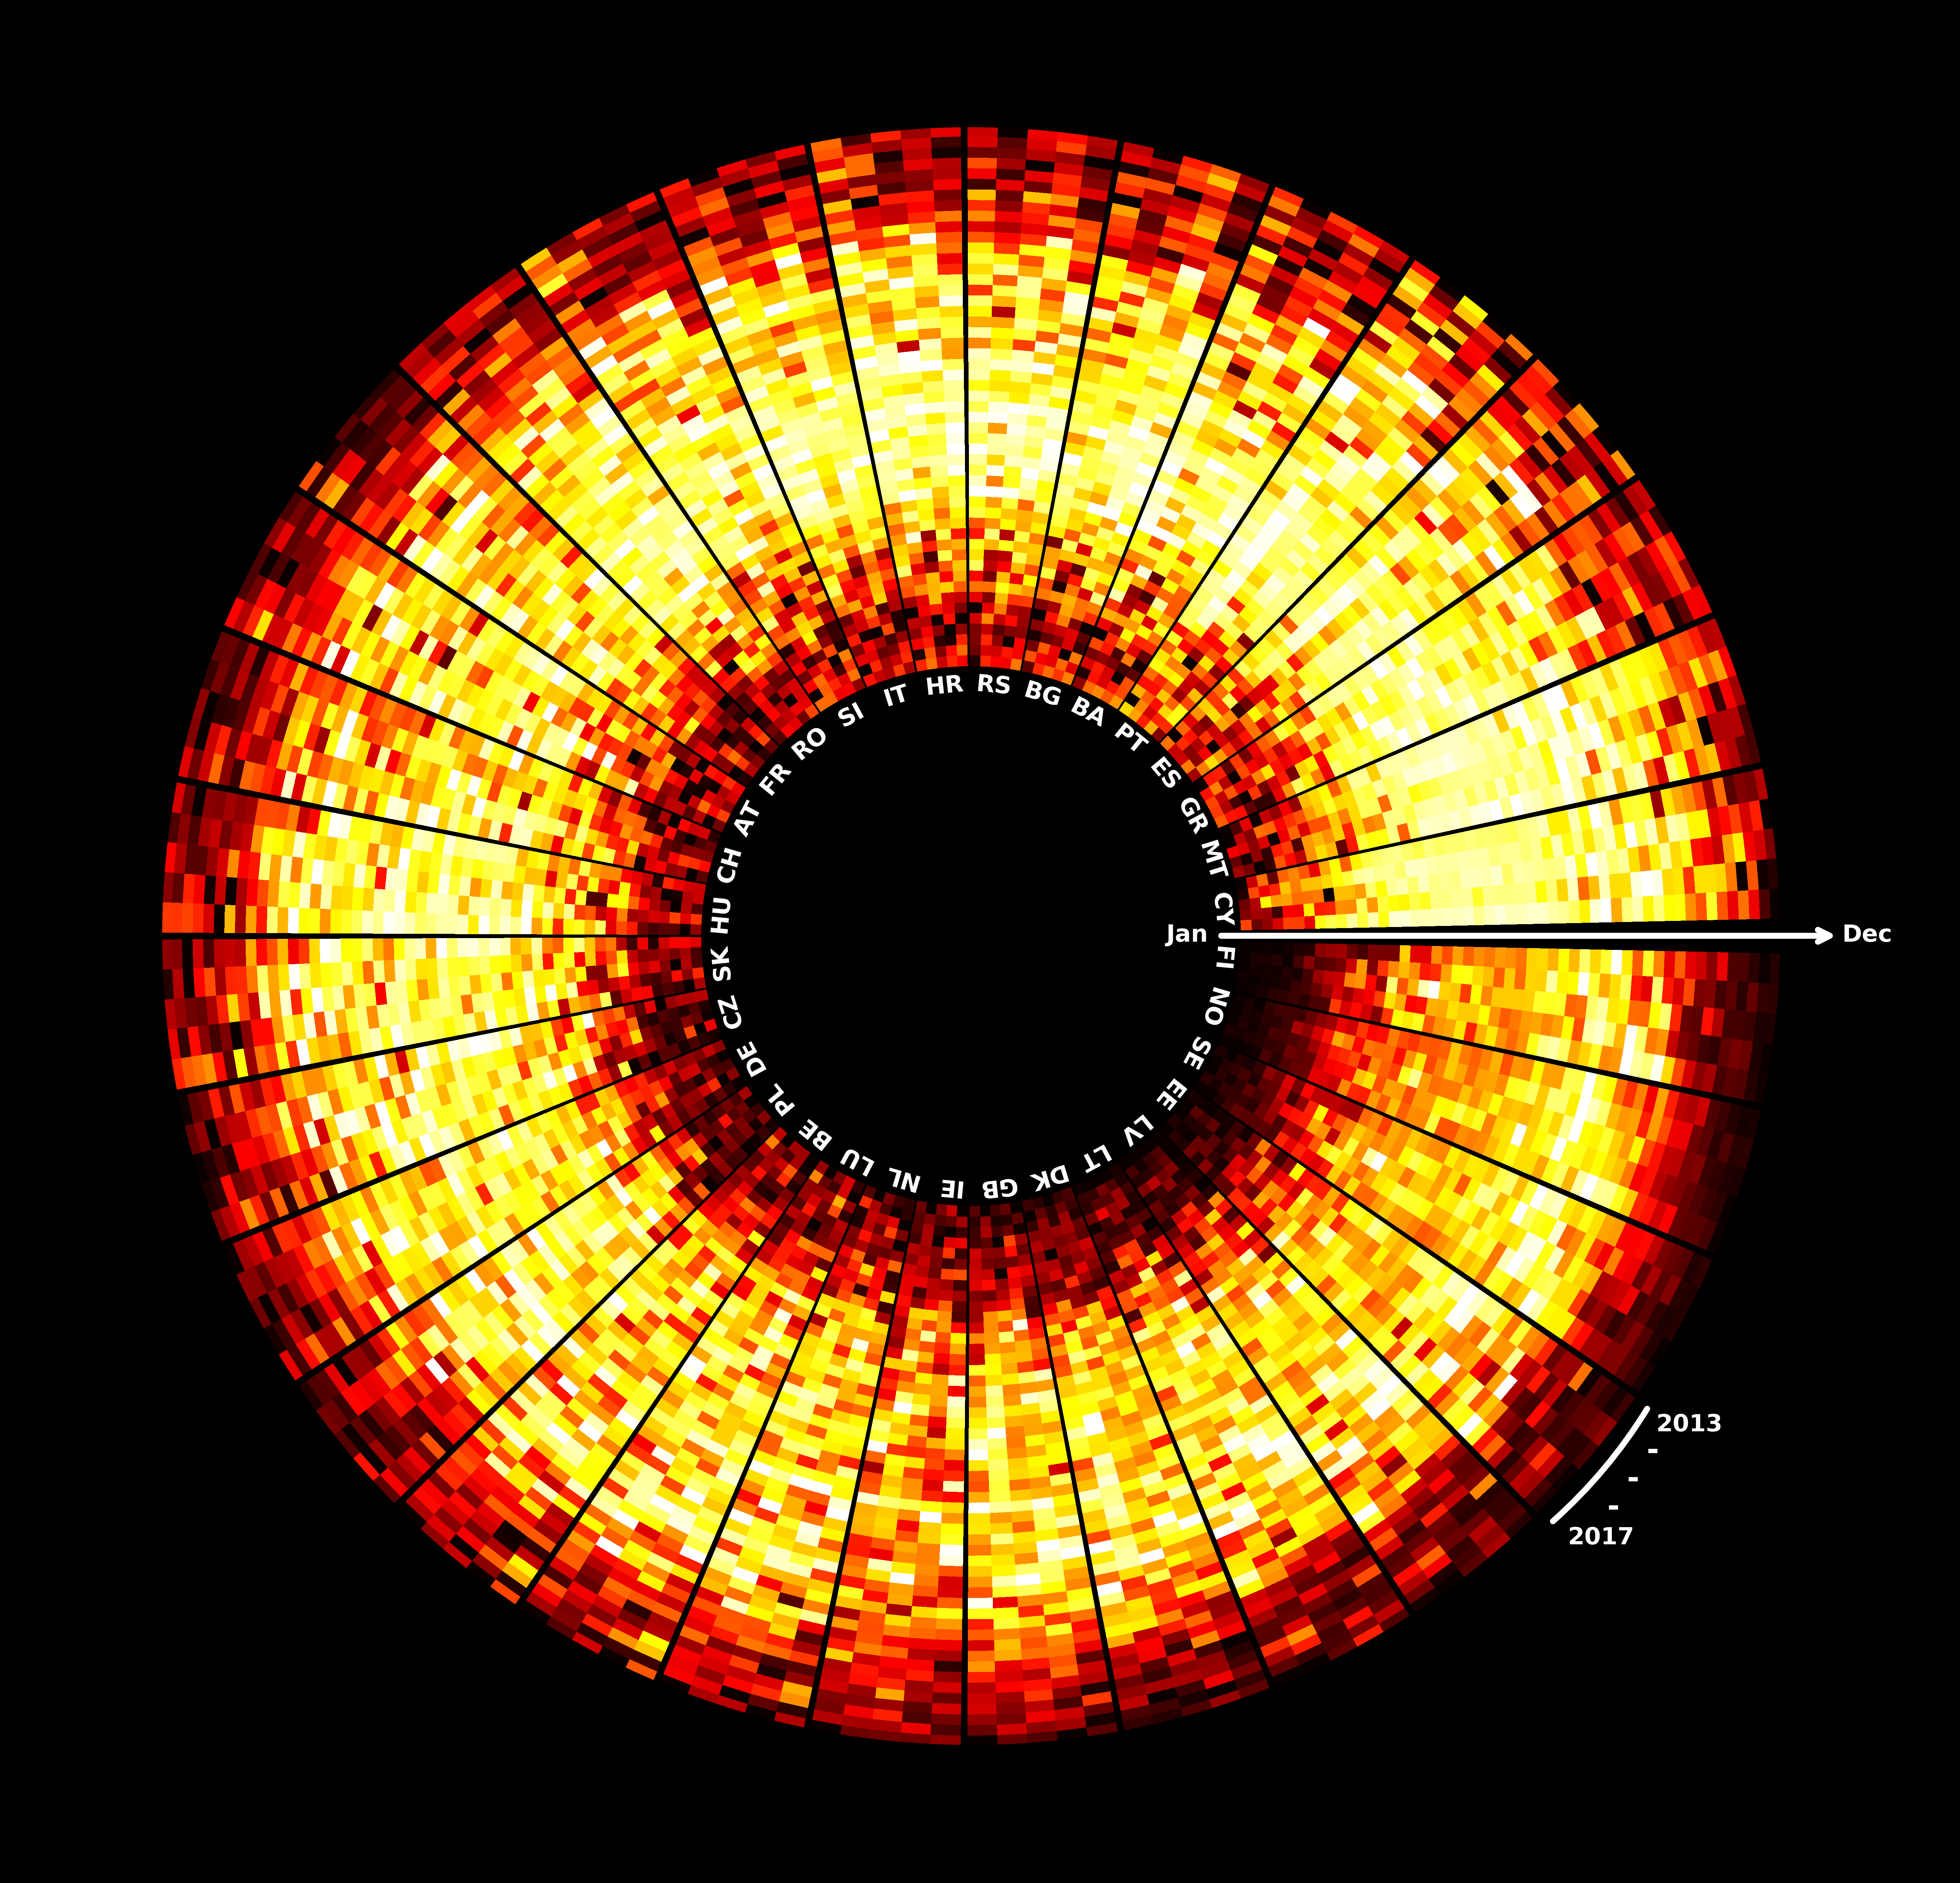
Top image: This visualization by Marta Victoria shows the total energy production from solar panels in all European countries 2013-2017. Each pixel represents a week’s energy production: The lighter the colour the more energy produced. In the inner part of the circle is January. Every slice of the circle is one country. The countries are ordered by latitude, starting with Cyprus and ending with Finland.
Since launch in late March 2019 the data sets have been downloaded more than 2.600 times. The data is available via the Zenodo repository for EC funded research, part of the OpenAIRE project, here.
On country level
Marta Victoria elaborates:
“What we are doing is modelling solar photovoltaic generation time series representing the energy production not in one single installation but in a whole country. This is necessary right now, because there are several countries in Europe for which the solar penetration is starting to become significant, like in Germany, where 7 per cent of the electricity comes from solar cells.”
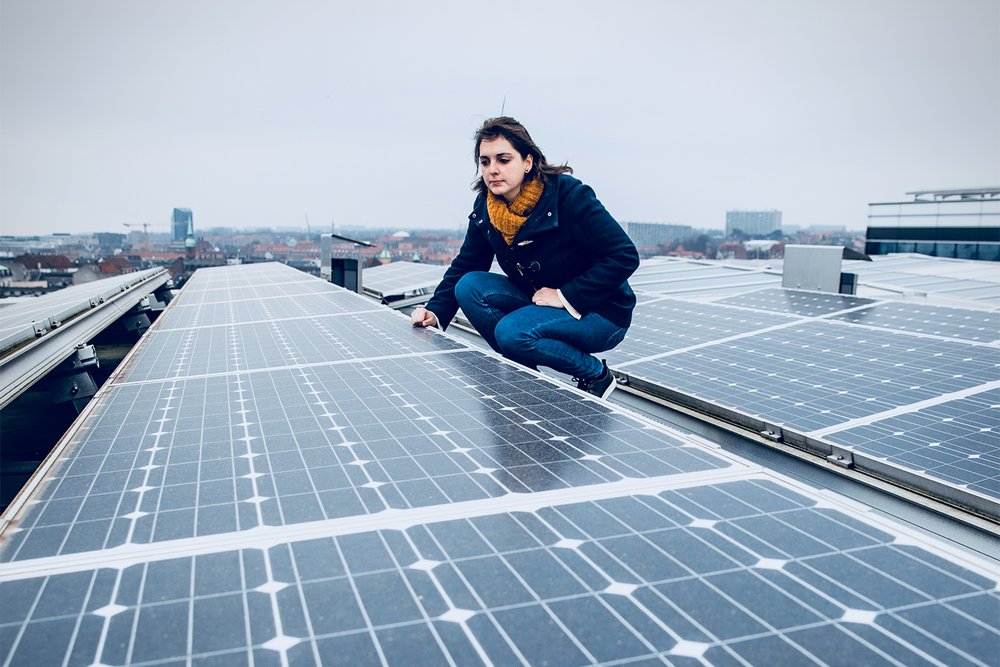 “This means we need to understand the time patterns for solar energy generation at country level. This is different from modelling one small installation, because we need to know the weather across the whole country and how it is influencing the power output. These things are important, because solar PV is non-dispatchable, as opposed to conventional, dispatchable energy sources like coal-fired power plants. Solar energy, as well as wind energy demand that the rest of the power system in a country can adapt to it.” (Image above by Lars Kruse, Aarhus University)
Globally applicable
“We have developed a methodology that is globally applicable. We have done that by taking a model designed by climatologists comprising more than 40 years of global sun, weather and temperature data with a spatial resolution of 40×40 km. On top of that we have satellite data about solar irradiance on the ground. This data we can correlate with historical output data from European solar power facilities.”
Tool for energy system designers
“Using our model you can estimate, how much energy solar PV panels can produce. Our model converts solar irradiance and temperature into electricity generation. You can model not only one single installation, but solar energy production for a whole country or even a continent, and we hope this can become an important tool for the people designing the complex, decentralized energy systems of the future.”
Computationally intense
The model requires a lot of input data that is computationally intense to process. For that Marta Victoria and her colleagues use their own local simulation cluster at the Department of Engineering. They download the terabyte-scale climate and satellite data sets to the cluster via high-speed Research & Education network connectivity.
Although the researchers have produced time series for every country in Europe with hourly data for 40 years, the output of the model is less data heavy. It is uploaded to the Zenodo open repository and freely available.
So, if you want to model the future energy system in e.g. Denmark, and you ask yourself if installing wind and solar will be enough or if you need additional energy sources, you can go to the open repository and download time series of solar generation in Denmark and use that for your application. And because the model provides 40 years of data you can re-run your analysis to see if the variation in weather between one year and the other is affecting your result.
For home owners as well
While this model of solar energy potential is targeting researchers, energy experts, and professional installers of solar panels, Marta Victoria is currently running a parallel project with a different target audience:
Together with one of her master students she is working on making the model available and useable for private individuals, e.g. home owners considering installing their own solar panels.